AP Program Results: Class of 2023
Celebrating the Class of 2023
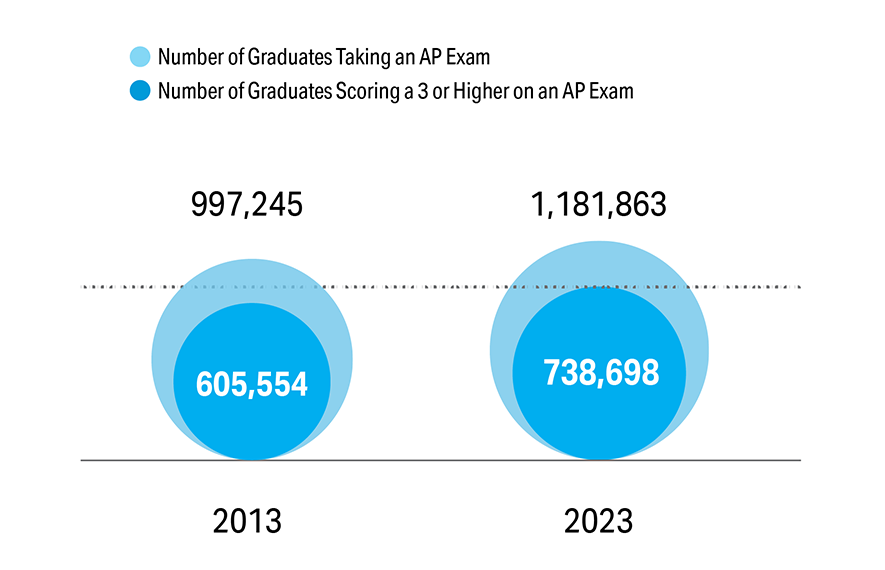
Between 2013 and 2023, the percentage of U.S. public high school graduates who took an AP Exam has increased, as has the percentage of U.S. public high school graduates who scored a 3 or higher on at least one AP Exam.
- 1,181,863 students in the class of 2023 (34.7% of U.S. public high school graduates) took at least 1 AP Exam, up from 31.5% of the class of 2013.
- 738,698 students in the class of 2023 (21.7% of U.S. public high school graduates) scored a 3 or higher on at least 1 AP Exam, up from 19.1% of the class of 2013.
National Highlights
- Nearly 1.2 million students in the class of 2023 took more than 4.1 million AP Exams in public high schools nationwide, as educators across the country continue to enable a wider and more diverse population of students to participate in AP.
- 34.7% of 2023 U.S. public high school graduates took at least 1 AP Exam during high school, and 21.7% of the graduating class scored a 3 or higher on at least 1 AP Exam.
- Over the past 10 years, the percentage of all U.S. public high school graduates earning a score of 3 or higher on at least 1 AP Exam has grown by 2.6 percentage points.
- 423,262 traditionally underrepresented students—including Black/African American, Hispanic/Latino, and American Indian/Alaska Native students—graduated in 2023 from U.S. public high schools having taken at least 1 AP Exam, up 139,856 students from 2013.
Measuring Success
A state’s success with AP is measured by a combination of access and performance.
States are ranked by the percentage of the public school students in the state’s graduating class scoring a 3 or higher on an AP Exam during high school.
This percentage shows the proportion of the graduating class that demonstrated college-level mastery through AP during high school. Each graduate who scores a 3 or higher “counts” only once toward the percentage, regardless of how many AP Exams they take or how many scores of 3 or higher they receive. As a result, this measure highlights inclusivity and reveals the extent to which the graduating class is receiving adequate preparation and fair access to AP.
Educators and policymakers can use this measure to gauge the overall success of their graduates with AP. Schools receive similar information in their score reports, which they use to compare their own AP success to results in their state and nationwide
What Do the Data Show?
- 21.7% of U.S. public high school graduates scored a 3 or higher on an AP Exam during high school
- 31.3% of public high school graduates in Massachusetts scored a 3 or higher on an AP Exam during high school, leading the nation
Percentage of the Class of 2023 Scoring a 3 or Higher on an AP Exam During High School, By State
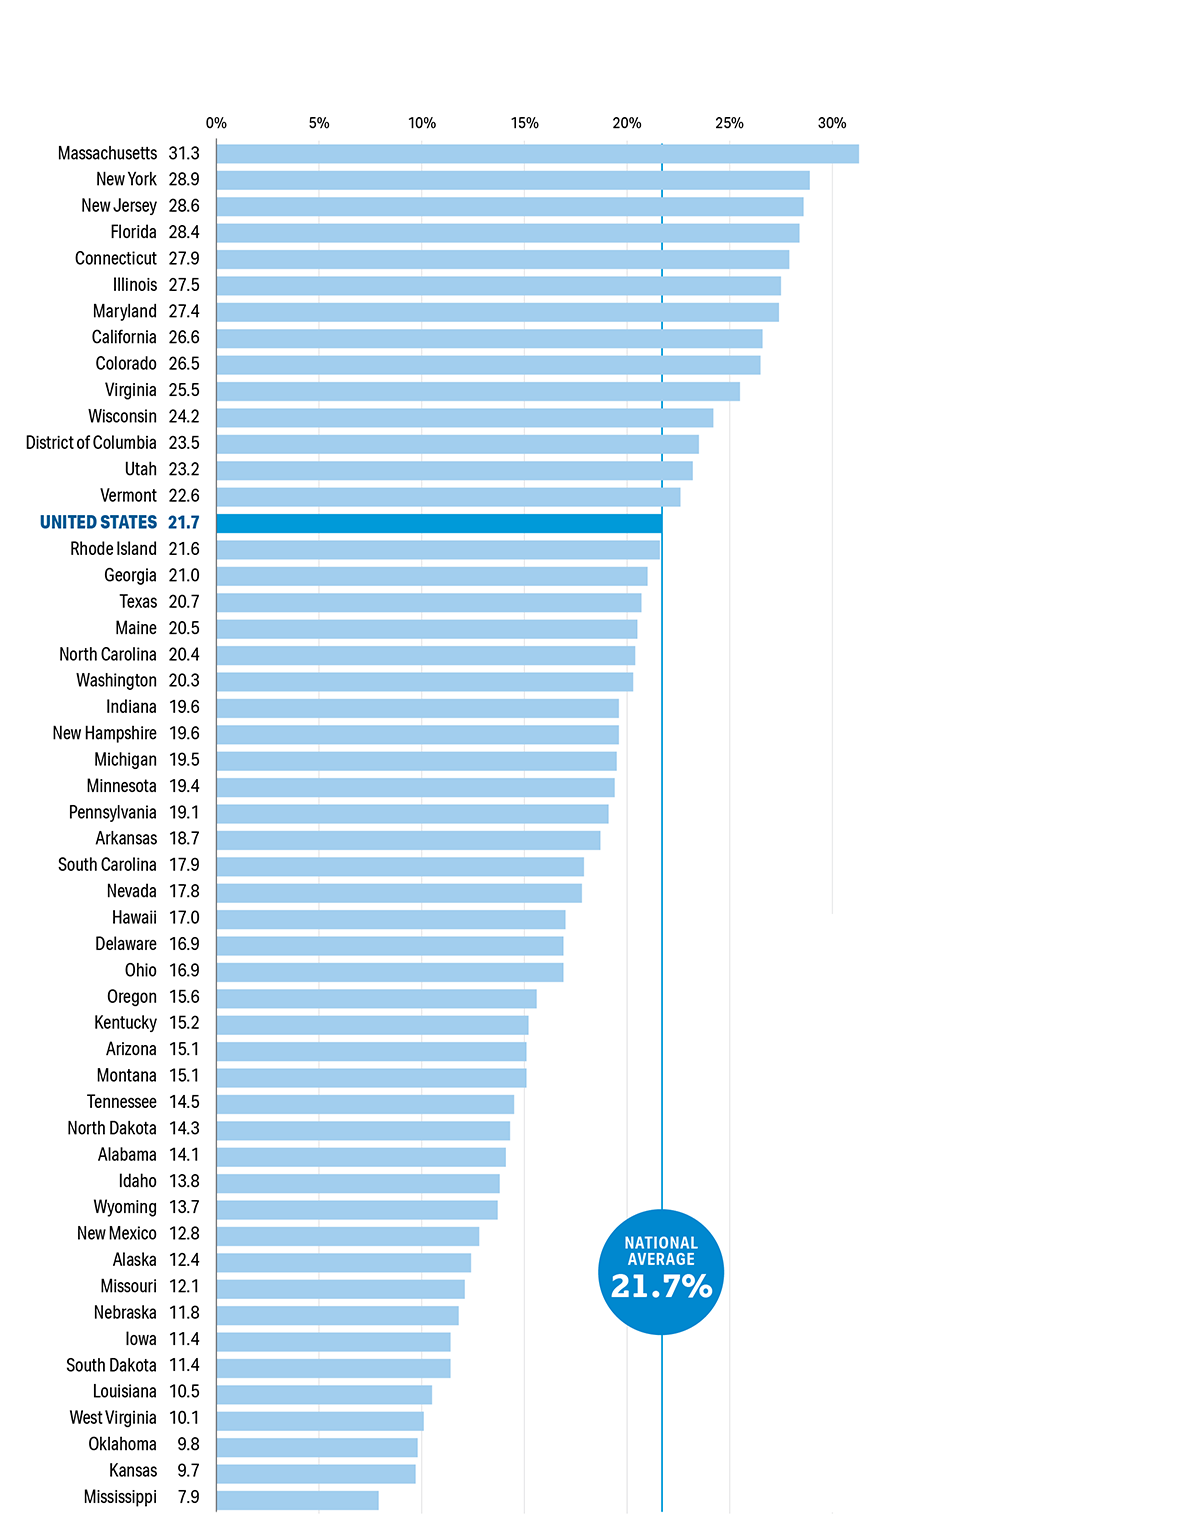
States with a tie in the rankings are listed alphabetically.
Participation Matters
Students take AP courses in high school, in part, for the chance to earn college credit, advanced placement, or both from a score of 3 or higher on an AP Exam. However, new evidence confirms what AP teachers say and know to be true: Students benefit from taking AP courses and exams, regardless of their exam scores.
Research findings highlight how AP students who earn scores of 1 and 2 benefit from their experiences in AP:
- Students are more likely to enroll in a 4-year college. AP students, including those with average scores of 1 or 2, are more likely to enroll in a 4-year college, compared to academically similar students who didn’t take AP in high school.
- Students perform as well or better in introductory college courses. Students who earn AP scores of 2 are well prepared to succeed in introductory college coursework. Compared to academically similar college peers who didn’t take an AP course, AP students who earn scores of 2 perform as well or better when they take those introductory college courses.
- Students go on to score higher on subsequent AP Exams. Many students who first score a 1 or 2 on an AP Exam will take further AP courses and score higher.
States have made progress to increase participation in AP over the last 10 years.
What Do the Data Show?
District of Columbia, Mississippi, Louisiana, Illinois, and New Jersey had among the largest 10-year growth in the percentages of graduates taking an AP Exam during high school.
Given the research showing the powerful benefits of AP for students who take the exam, regardless of their score, it is notable that states have made significant progress in supporting students in taking exams.
10-Year Change in the Percentage of Graduates Taking an AP Exam During High School, Ranked by the Percentage of the Class of 2023
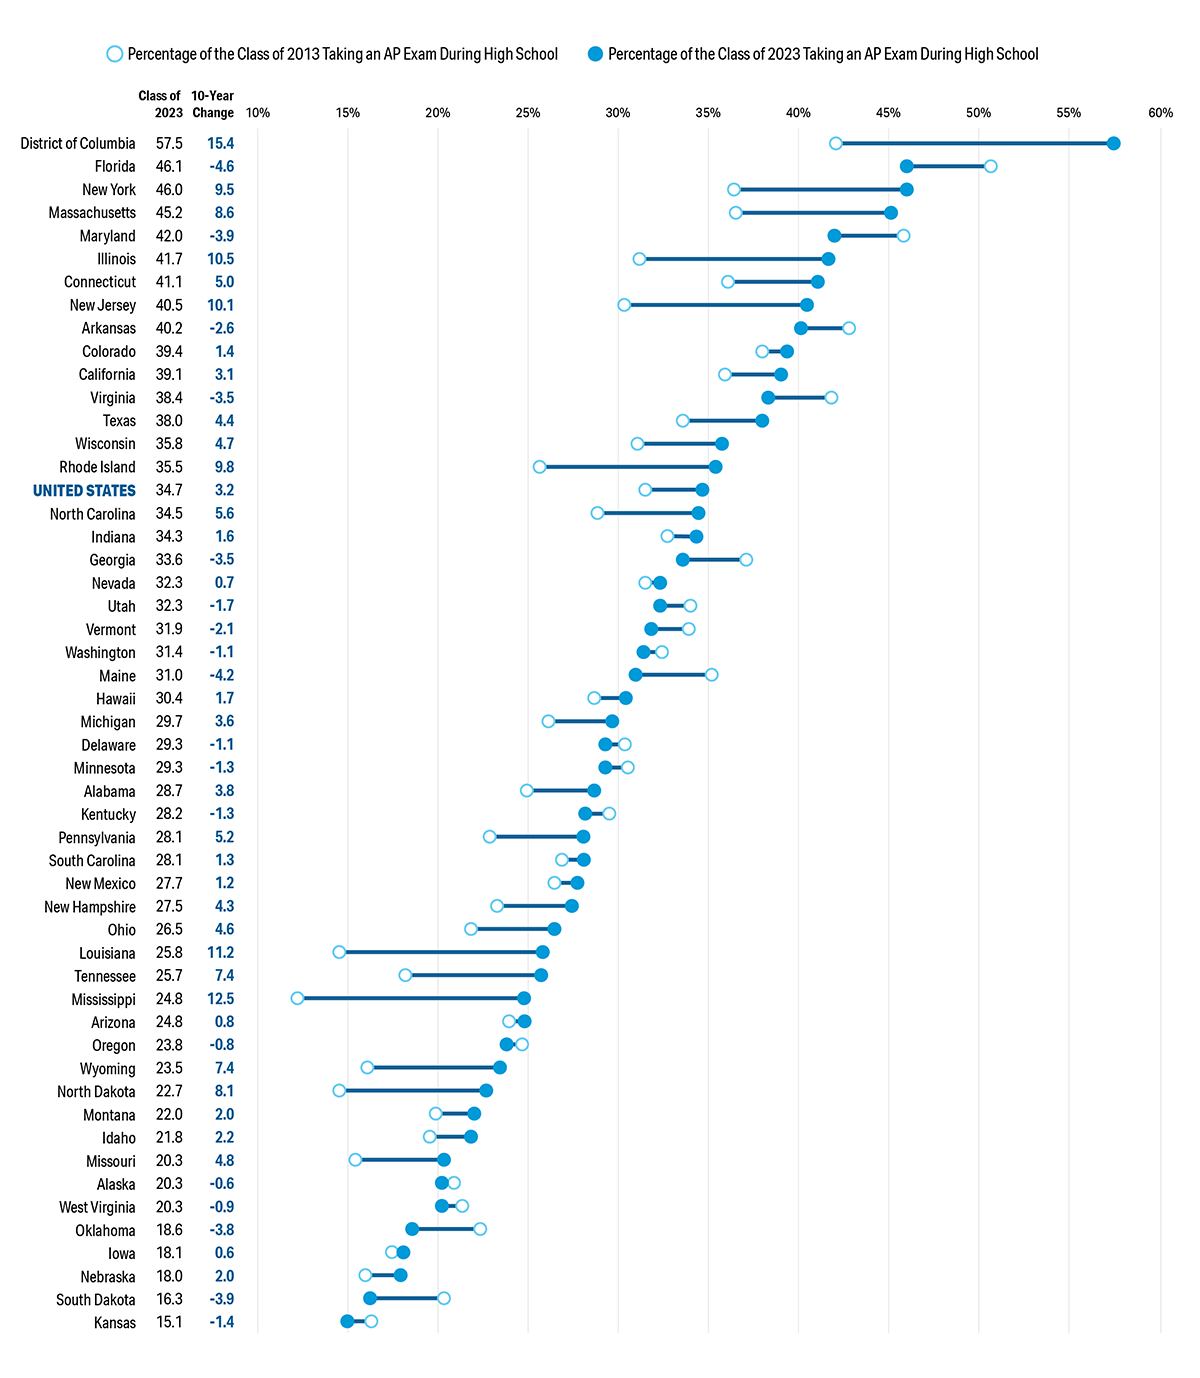
States with a tie in the ranking for percentage of the class of 2023 taking an AP Exam are ordered by 10-year change.
Resources
Article
Article